Please read these posts if you are not familiar with the V-E-J Tidal Torquing model:
http://astroclimateconnection.blogspot.com.au/2012/03/planetary-spin-orbit-coupling-model-for.html
http://astroclimateconnection.blogspot.com.au/2012/03/short-comings-of-planetary-spin-orbit.html
http://astroclimateconnection.blogspot.com.au/2012/04/why-does-solar-cycle-keep-re.html
http://astroclimateconnection.blogspot.com.au/2012/04/v-e-j-tidal-torquing-model-maunder.html
occur tangentially to the surface of the Sun, if the gravitational
force of Jupiter were to tug upon the combined tidal bulge
that is induced in the convective layer of the Sun by the
periodic alignments of Venus and the Earth (every 1.599
years). In essence, whenever the cumulative acceleration
is increasing (i.e its slope is positive), the tugging gravitational
force of Jupiter increase the rotation rate of a layer of plasma
in the Sun's convective layer [assumed to be a dynamically
decoupled layer ~ 0.02 % of the mass of the Sun]. Similarly,
whenever the cumulative acceleration is decreasing (i.e its
slope is negative), the tugging gravitational force of Jupiter
decrease the rotation rate of a layer of plasma in the Sun's
convective layer.
N.B. It is reasonable to assume that the dynamically
decoupled layer in the Sun's convection region is likely
to be at the base of the convective zone near the
Tachocline, since this is where most solar scientists
believe that the solar dynamo is formed.
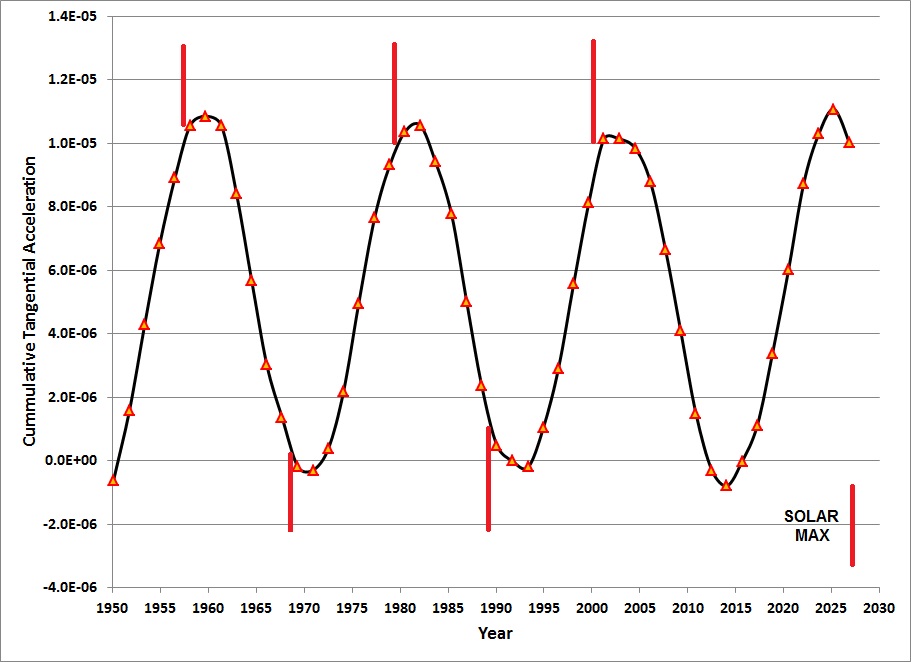
Figure 1a shows this cumulative acceleration between the
years 1880 and 1960, while figure 1b shows the corresponding
plot between the years 1950 and 2030.
Superimposed on each of these figures are the times of solar
maximum for solar sunspot cycles 13 through 23.
Figure 1a

Figure 1b
Whenever the Sun's sunspot cycles were weak, as in
the later parts of the 19 th century and the first 40 years
of the 20 th century (i.e. cycles 13 through 17), the
rotation velocity of the layer in the convective region of
the Sun changed direction PRIOR TO the date of solar
sunspot maximum.
Whenever the Sun's sunspot cycles were strong, as in
the last 60 years of the 20 th century (i.e. cycles 18
through 23), the rotation velocity of the layer in the
convective region of the Sun changed direction AFTER
the date of solar sunspot maximum.
What this suggests is that there could be a correlation
between the relative timing of the change in rotation
velocity of the layer in the convective region that is being
spun up and spun down by Jupiter's gravitational force.
Figure 2a shows the peak Solar sunspot number for cycles
-4 through 23 [covering the period from 1698 to 2009]
plotted against the number of years that the Jupiter
induced change in direction of rotation of the layer in
the convective zone, occurs BEHIND the year of solar
maximum [i.e. Solar maximum minus peak cumulative
acceleration in years].
the convective zone, occurs BEHIND the year of solar
maximum [i.e. Solar maximum minus peak cumulative
acceleration in years].
The data in figure 2a clearly shows that there is indeed
a moderately good correlation between these two
variables (R = 0.678).
Figure 2a

is that there are three solar sunspot cycles associated with
the Dalton Minimum (i.e cycles 4, 5 and 6 which are
labelled in the diagram) that are systematically shifted towards
lower left of the figure. This raises the possibility that during
periods of low solar activity like that in the Dalton Minimum,
the Sun may respond differently to the tidal-torquing of Jupiter
than at times of "normal" solar sunspot activity.
Figure 2b below, shows that if these three unusual solar cycles
are excluded from the data set, the quality of the correlation
greatly improves, with the new linear correlation co-efficient
being R = 0.784.
Figure 2b


Hence, provided we exclude the unusual solar sunspot

This is comparable to the level of correlation that exists between
the peak sunspot number for a solar cycle and the time it takes
[in years] for that sunspot cycle to reach maximum.
Figure 3 shows the relationship between the peak solar sunspot
number and the time required for that sunspot cycle to reach its
maximum for solar cycles -4 through 23. As you can see, there
is a very good correlation between these two parameters with
the correlation coefficient being R = 0.810.
Figure 3

cycles associated with grand solar minima, there appears
to be an excellent correlation between peak sunspot
number of a solar-cycle and the timing of the Jupiter induced
change in direction of the rotation rate [of a layer in the
convective zone of the Sun] compared to the timing of
solar maximum.
Peak SSN = -13.485 x (SOL MAX - PEAK of Cumulative Acceleration) + 116.05
Unfortunately, this relationship cannot be used to predict the
peak SN for the next two solar cycles, as there is a strong
possibility that both cycles 24 and 25 will be very similar to
cycles 5 and 6 in the Dalton Minimum. Evidence for this can
be seen in figure 4.
Figure 4 is a reproduction of figure 2a, with a box superimposed
on the figure showing were we expect solar cycle 24 to be
located if it reached a sunspot maximum some time between
2013 and 2014, with a peak sunspot number between 65
and 85. This places cycle 24 in similar part of the diagram as
solar cycles 5 and 6.
N.B. The relation between peak SN and the rise time of a solar
cycle [shown in figure 3] would point to a maximum for cycle 24
that is either at or after 2014, tending to favor a location for cycle
24 that is at the right hand side of the box in figure 4.
Figure 4

link the level of solar sunspot activity to planetary motions,
the simple V-E-J Tidal-Torquing model [that has been
presented in this blog] implicitly produces many of the
observed properties of the Solar sunspot cycle without
any need for a "phase-catastrophe" to realign the planetary
motions with the solar dynamo.
If you want to see how the V-E-J Tidal-Torquing model
implicitly produces many of the observed properties of the
Solar sunspot cycle then you can download the following
paper in the General Science Journal for free:
http://www.wbabin.net/Science-Journals/Research%20Papers-Astrophysics/Download/3812
Do Periodic Peaks in the Planetary Tidal Forces
Acting Upon the Sun Influence the Sunspot Cycle?
Ian R. G. Wilson 2010
No comments:
Post a Comment